Telewizor zawsze był magnesem w domu, który gromadził przyjaciół i rodzinę, aby cieszyć się rozrywką i towarzystwem. Pozostaje to prawdą do dziś, ale fizyczny odbiornik telewizyjny stał się czymś więcej niż tylko oknem na tradycyjne programy. Oglądanie telewizji na żywo pozostaje stałym elementem naszej diety medialnej, ale streaming ma stanowić jedną trzecią całkowitego czasu oglądania telewizji przez konsumentów w USA do końca tego roku.
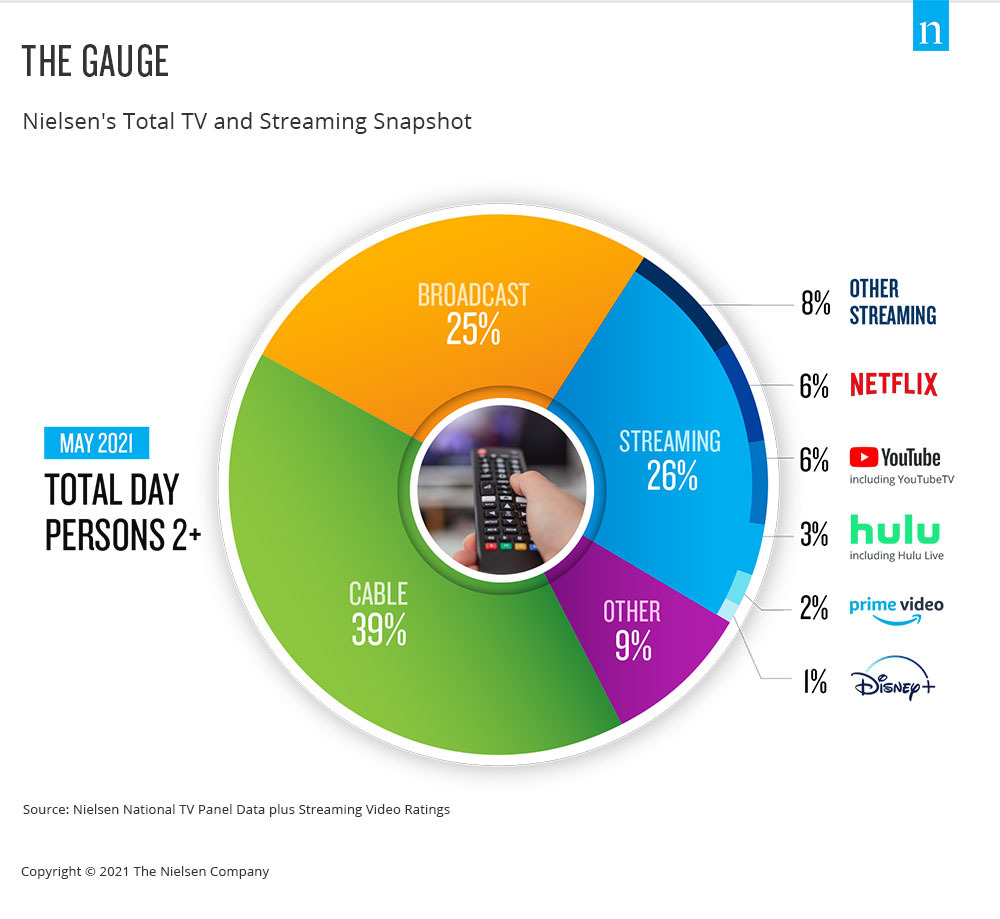
Few areas of the media landscape have been in focus over the past year as streaming video content has, and the TV set is a key portal for that engagement. There is no shortage of news and hype about the streaming landscape, as well as how streaming engagement has dramatically altered video viewing, as it now accounts for 26% of total TV usage. While that statistic is telling on its own, it doesn’t contextualize streaming usage within the broader usage of TV.
From a media industry perspective, nothing is more valuable than accurate, comparable data. And as audiences no longer see a difference between traditional TV, streaming and digital, measurement shouldn’t either. That’s where the Gauge, Nielsen’s total TV and streaming snapshot, comes in. This important step forward in the journey toward true cross-platform measurement and Nielsen ONE simplifies TV usage, illustrating television consumption behavior in a single graphic. With this view, to be updated monthly, industry participants will be able to see critical behavioral shifts and consumer trends with respect to total TV viewing. Additionally, the Gauge tracks “other” use of the TV, such as via game consoles, to give an accurate view of what people are doing in their dens and living rooms.
Importantly, the Gauge does more than simply chart streaming behavior within U.S. homes that have the ability to stream. The snapshot represents streaming across wszystko television homes, which means that the share of streaming more accurately represents consumer behavior in a way that’s easy to describe and understand. The new representation also shows select streaming distributor shares against the total television universe so it provides better comparability within television usage.
Śledzenie wzrostu konsumpcji strumieniowej - i oglądanie jej wraz z innymi sposobami korzystania z telewizji - ma kluczowe znaczenie, ponieważ studia, sieci, reklamodawcy, agencje i grupy branżowe szukają jasności co do różnych treści wideo, z których korzystają konsumenci.
Podejście firmy Nielsen do pomiaru oglądalności, które wykorzystuje reprezentatywny geograficznie panel prawdziwych ludzi i duże zbiory danych, zostało stworzone z myślą o przyszłości konsumpcji mediów. A dzięki the Gauge przyszłość konsumpcji telewizji jest widoczna w jednym widoku.
For more information visit Wskaźnik.
Metodologia
- Streaming za pośrednictwem dekoderów telewizji kablowej nie jest przypisywany do odpowiednich dystrybutorów streamingu, ale zamiast tego jest uwzględniany w grupie "wszystkie inne".
- Data used is derived from two separately weighted panels and combined to create the infographic. Streaming data comes from a subset of TV households in the national TV panel that are enabled with the streaming meter, while linear sources as well as total usage are based on viewing from the overall TV panel.
- Zakodowana linearna transmisja strumieniowa jest odzwierciedlona zarówno w grupie linearnej (nadawczej, kablowej), jak i w odpowiedniej aplikacji do linearnej transmisji strumieniowej (np. Hulu Live, YouTube TV, inne aplikacje MVPD/vMVPD do transmisji strumieniowej).
