텔레비전은 항상 가정에서 친구와 가족이 함께 모여 엔터테인먼트를 즐기고 서로의 교제를 나누는 자석과 같은 역할을 해왔습니다. 이는 오늘날에도 여전히 유효하지만, 실제 TV 세트는 전통적인 프로그램을 시청하는 창구 그 이상이 되었습니다. 예약된 실시간 TV 시청은 여전히 미디어 다이어트의 핵심이지만, 스트리밍은 올해 말까지 미국 소비자의 총 TV 시청 시간의 3분의 1을 차지할 것으로 예상됩니다.
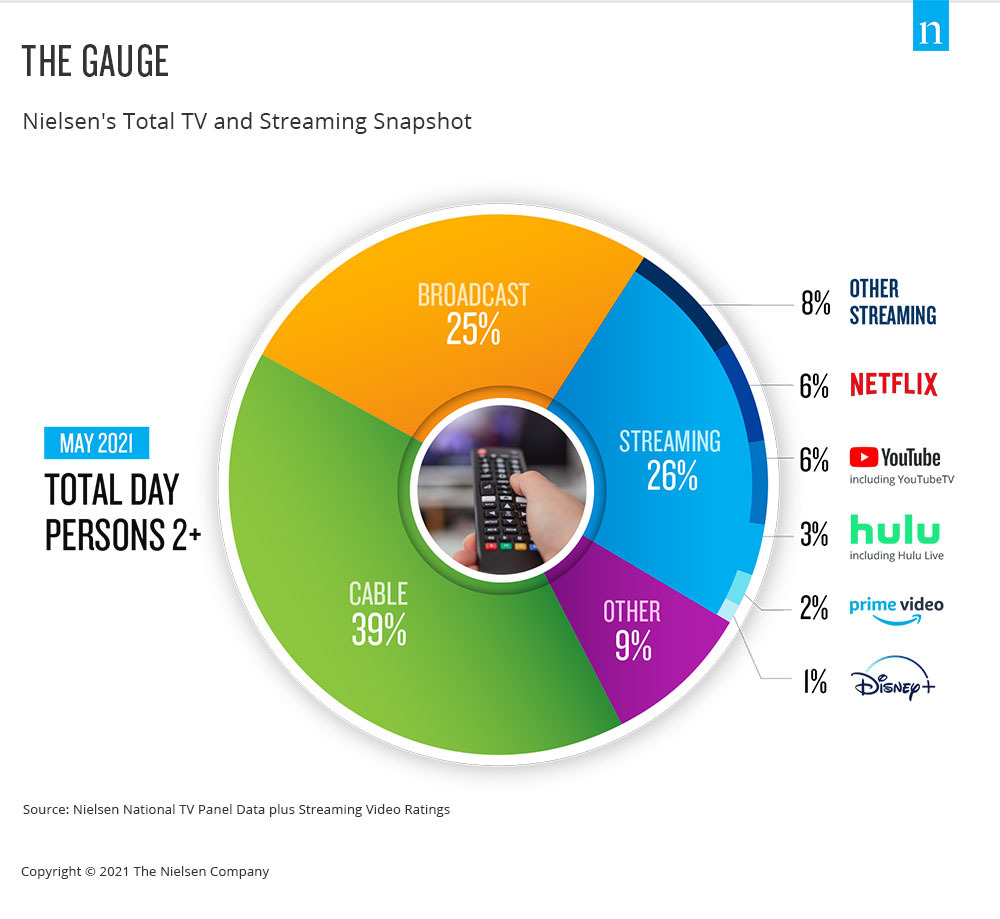
Few areas of the media landscape have been in focus over the past year as streaming video content has, and the TV set is a key portal for that engagement. There is no shortage of news and hype about the streaming landscape, as well as how streaming engagement has dramatically altered video viewing, as it now accounts for 26% of total TV usage. While that statistic is telling on its own, it doesn’t contextualize streaming usage within the broader usage of TV.
From a media industry perspective, nothing is more valuable than accurate, comparable data. And as audiences no longer see a difference between traditional TV, streaming and digital, measurement shouldn’t either. That’s where the Gauge, Nielsen’s total TV and streaming snapshot, comes in. This important step forward in the journey toward true cross-platform measurement and Nielsen ONE simplifies TV usage, illustrating television consumption behavior in a single graphic. With this view, to be updated monthly, industry participants will be able to see critical behavioral shifts and consumer trends with respect to total TV viewing. Additionally, the Gauge tracks “other” use of the TV, such as via game consoles, to give an accurate view of what people are doing in their dens and living rooms.
Importantly, the Gauge does more than simply chart streaming behavior within U.S. homes that have the ability to stream. The snapshot represents streaming across all television homes, which means that the share of streaming more accurately represents consumer behavior in a way that’s easy to describe and understand. The new representation also shows select streaming distributor shares against the total television universe so it provides better comparability within television usage.
스튜디오, 네트워크, 광고주, 대행사 및 업계 그룹이 소비자가 참여하는 다양한 동영상 콘텐츠에 대한 명확성을 추구함에 따라 스트리밍 소비의 성장을 추적하고 다른 TV 사용량과 함께 시청하는 것은 매우 중요합니다.
지역을 대표하는 실제 패널과 빅 데이터를 활용하는 닐슨의 시청률 측정 방식은 미디어 소비의 미래를 위해 구축되었습니다. 그리고 the Gauge 통해 TV 소비의 미래를 한 눈에 볼 수 있습니다.
For more information visit 게이지.
방법론
- Streaming via cable set top boxes does not credit to the respective streaming distributors, but instead is included in the “all other” group.
- Data used is derived from two separately weighted panels and combined to create the infographic. Streaming data comes from a subset of TV households in the national TV panel that are enabled with the streaming meter, while linear sources as well as total usage are based on viewing from the overall TV panel.
- 인코딩된 선형 스트리밍은 선형(방송, 케이블) 그룹과 각 선형 스트리밍 앱(예: Hulu Live, YouTube TV, 기타 스트리밍 MVPD/vMVPD 앱) 아래에 모두 반영됩니다.
