TV has changed dramatically in recent years. New devices, distributors, streaming platforms, subscription models, and formats are transforming the industry and empowering viewers. But there’s one thing that hasn’t changed: People love to watch TV together.
It depends on the occasion, of course—what the program is, the time of day, the size of the screen, what room it’s in, the size of the family and whether anyone simply happens to be around. But people get together today to watch the スーパーボウル or The Bachelorette for the same reason they got together to watch M*A*S*H or the Apollo 11 moon landing half a century ago: to have someone to share the experience with.
In the lingo of the media industry, that’s known as co-viewing. Let’s examine why it’s so important for measurement companies to get it right.
一緒にテレビを見る頻度は?
ニールセンでは長い間、共同視聴を研究してきた。ニールセンの歴史的な測定ソリューションは、主要な放送ネットワークがほんの一握りだった時代から、常に人をベースにしてきました。そのため、共同視聴を測定するための信頼できる情報源を常に持っていたのです。今日、アメリカ中の家庭で、リニアTVとコネクテッドTV(CTV)の47%1が一度に複数の人によって視聴されています。
Today, there’s virtually no difference in co-viewing rates between linear TV and CTV, but it wasn’t always the case. Back in 2017, we ran a study with Roku and found a significant gap in co-viewing between linear TV (48%) and OTT (34%). Since then, smart TVs have become more widespread and large screens more affordable. And, increasingly, consumers don’t make the distinctions between linear and streaming or TV and digital. It’s all TV.
But that doesn’t mean that there aren’t any variations and that the same co-viewing factor can be applied across the board. There’s more co-viewing during primetime and on weekends, for sports and children programming, among men, young adults and in houses with more children. It also matters where the TV is located inside the house. Every case is different, and the only way to properly account for co-viewing is to measure it directly or model it separately for every ad impression.
人々が一緒にテレビを見ているかどうか、なぜ気にするのか?
Most brands want to reach people, not households—and certainly not faceless devices. Wholesale ad impressions are nice, but they’re not enough. When they buy media, advertisers and their agencies spend top dollars to reach specific demographic targets (like 18-34 year-old women in Philadelphia, or 55+ in Arizona) or advanced audiences (like EV drivers who buy organic). They need guarantees that their ads are reaching the right people, and measuring co-viewing gets to the heart of that question.
メディア企業は、視聴者を理解し、番組を最適化し、広告在庫に適切な価格をつけるために、誰が自社のコンテンツを見ているかを知る必要がある。例えば、ある新番組が若年層に特に好評であれば、新シーズンを発注し、類似番組を企画し、ニッチなファンを開拓して、それを収益化して加入者を増やしたり、そのような視聴者にリーチしようと躍起になっている広告主を引き付けたりすることができる。
今日の高度に細分化された、非常に競争の激しいテレビ業界では、メディア企業はもはや「トン数」を売っているわけではなく、広告主は無差別に「目玉」を買っているわけでもない。広告主は無差別に「眼球」を買っているわけではない。視聴者の重複排除(デバイス内およびデバイス間)、オンターゲット広告配信の計算、リーチとフリークエンシー(頻度)の最適化、主要キャンペーンのパフォーマンス指標(ターゲット・デモの効率率など)の改善を支援できる測定ソリューションが必要なのだ。個人レベルの測定なしには、これらの目標を達成することはできません。
ニールセンではどのように共同視聴を測定しているのか?
The most direct way to measure co-viewing is to monitor TV viewership at the individual level. That’s the case with our National TV Panel and top Local TV Markets. In these markets, our panelists “check-in” to the audience. But to add more depth and stability to our audience solutions—and provide more visibility into smaller audiences in smaller TV markets—we’re increasingly relying on big data based on ACR (for smart TVs) return-path data (for cable and satellite providers), or device and context identifiers (for ad impressions). And those technologies only capture viewing information at the household level.
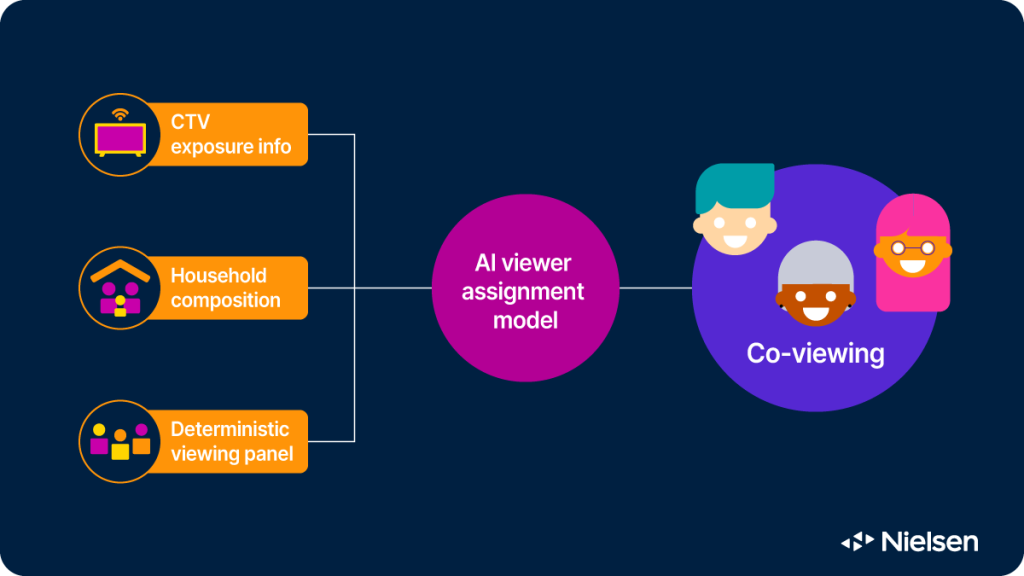
Nielsen is able to determine who is watching thanks to a process called Viewer Assignment that was developed a decade ago and has since been continuously refined. It uses advanced statistical techniques to match faceless viewing data from big data sources (like Roku, Vizio, Hulu, Netflix, YouTube and others) to our persons-level panel data for every possible viewing event and ad impression. The match is based on similarities in viewing behavior (down to the program level) as well as geography, household composition, device type and location inside the house, time of day, day of week, and other key predictors. The model never stops learning, and we’re constantly validating its performance to make sure it’s as close to reality as possible.
しかし、視聴者割り当てのようなプロセスは、視聴者データが欠落しているすべてのケースを補うものではないことを認識することが重要である。視聴データで見たものと信頼できるものが一致しなかったり、世帯構成が容易に入手できなかったりすることもある。全CTVデータの約9%については、年齢や性別のような単純な視聴者属性さえ割り当てることが困難なままである。このような場合、ニールセンは堅牢な予測モデルを用いて視聴者の割り当てを行います。
次はどうする?
最近の方法論の飛躍的進歩により、より多くの広告出稿に視聴者の特性を割り当てることができるようになり、その過程でリーチを測定する能力が大幅に向上しました。私たちのモデルは、ニールセンの膨大なデータとシグナルから常に学習しており、視聴者の予測をより包括的なものにし続けています。
共同視聴は常にテレビ体験の不可欠な一部であり、すぐに変わることはありません。あなたの測定戦略にも不可欠な要素であることを確認してください。
Nielsen’s Need to Know reviews the fundamentals of audience measurement and demystifies the media industry’s hottest topics. Read every article here.
備考
1Nielsen Panel Data


