Pesawat televisi selalu menjadi magnet di dalam rumah yang menyatukan teman dan keluarga untuk menikmati hiburan dan kebersamaan satu sama lain. Hal ini masih berlaku hingga saat ini, namun pesawat TV fisik telah menjadi lebih dari sekadar jendela untuk menonton program tradisional. Siaran TV langsung dan terjadwal tetap menjadi pilihan utama dalam pola konsumsi media kita, namun streaming akan mencapai sepertiga dari total waktu menonton TV konsumen di Amerika Serikat pada akhir tahun ini.
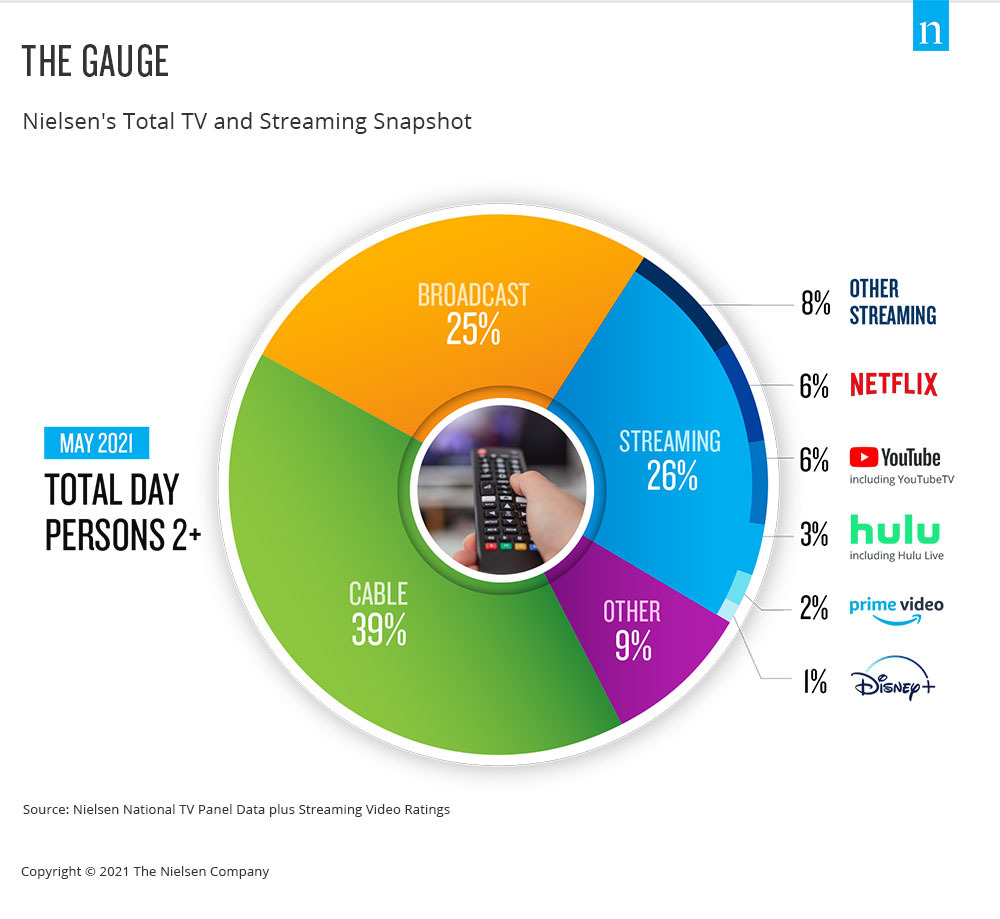
Few areas of the media landscape have been in focus over the past year as streaming video content has, and the TV set is a key portal for that engagement. There is no shortage of news and hype about the streaming landscape, as well as how streaming engagement has dramatically altered video viewing, as it now accounts for 26% of total TV usage. While that statistic is telling on its own, it doesn’t contextualize streaming usage within the broader usage of TV.
From a media industry perspective, nothing is more valuable than accurate, comparable data. And as audiences no longer see a difference between traditional TV, streaming and digital, measurement shouldn’t either. That’s where the Gauge, Nielsen’s total TV and streaming snapshot, comes in. This important step forward in the journey toward true cross-platform measurement and Nielsen ONE simplifies TV usage, illustrating television consumption behavior in a single graphic. With this view, to be updated monthly, industry participants will be able to see critical behavioral shifts and consumer trends with respect to total TV viewing. Additionally, the Gauge tracks “other” use of the TV, such as via game consoles, to give an accurate view of what people are doing in their dens and living rooms.
Importantly, the Gauge does more than simply chart streaming behavior within U.S. homes that have the ability to stream. The snapshot represents streaming across all television homes, which means that the share of streaming more accurately represents consumer behavior in a way that’s easy to describe and understand. The new representation also shows select streaming distributor shares against the total television universe so it provides better comparability within television usage.
Melacak pertumbuhan konsumsi streaming-dan melihatnya bersama dengan penggunaan TV lainnya-sangat penting karena studio, jaringan, pengiklan, agensi, dan kelompok industri mencari kejelasan seputar berbagai konten video yang digunakan konsumen.
Pendekatan Nielsen terhadap pengukuran pemirsa, yang memanfaatkan panel yang mewakili secara geografis dari orang-orang nyata dan data besar, dibangun untuk masa depan konsumsi media. Dan dengan the Gauge, masa depan konsumsi TV dapat dilihat dalam satu tampilan.
For more information visit The Gauge.
Metodologi
- Streaming melalui dekoder kabel tidak dikreditkan ke masing-masing distributor streaming, tetapi dimasukkan ke dalam kelompok "semua lainnya".
- Data used is derived from two separately weighted panels and combined to create the infographic. Streaming data comes from a subset of TV households in the national TV panel that are enabled with the streaming meter, while linear sources as well as total usage are based on viewing from the overall TV panel.
- Streaming linear yang dikodekan tercermin dalam kelompok linear (siaran, kabel) serta di bawah aplikasi streaming linear masing-masing (misalnya, Hulu Live, YouTube TV, aplikasi MVPD/vMVPD streaming lainnya)
