Der Fernseher war schon immer ein Magnet im Haus, der Freunde und Familie zusammenbrachte, um Unterhaltung zu genießen und sich gegenseitig zu unterhalten. Das ist auch heute noch so, aber das physische TV-Gerät ist viel mehr als nur ein Fenster zum traditionellen Programm. Live-Fernsehen ist nach wie vor ein fester Bestandteil unseres Medienkonsums, aber Streaming wird bis Ende dieses Jahres in den USA bereits ein Drittel der gesamten Fernsehzeit ausmachen.
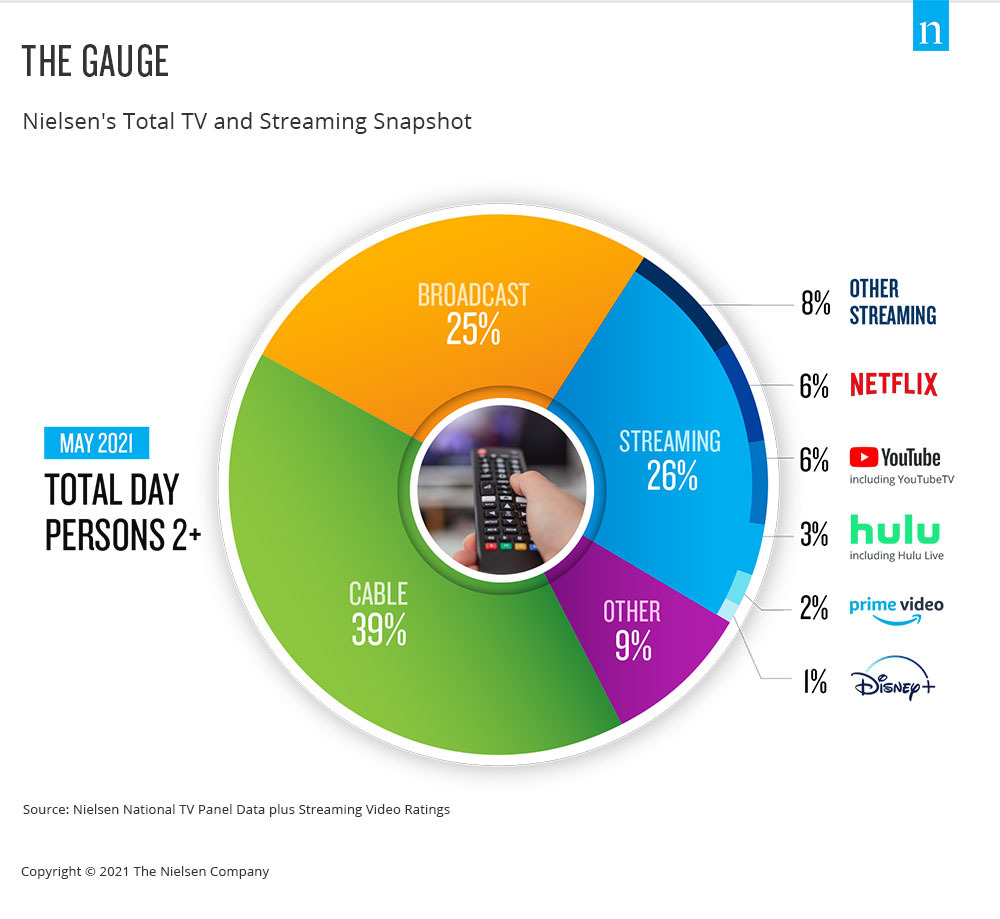
Few areas of the media landscape have been in focus over the past year as streaming video content has, and the TV set is a key portal for that engagement. There is no shortage of news and hype about the streaming landscape, as well as how streaming engagement has dramatically altered video viewing, as it now accounts for 26% of total TV usage. While that statistic is telling on its own, it doesn’t contextualize streaming usage within the broader usage of TV.
From a media industry perspective, nothing is more valuable than accurate, comparable data. And as audiences no longer see a difference between traditional TV, streaming and digital, measurement shouldn’t either. That’s where the Gauge, Nielsen’s total TV and streaming snapshot, comes in. This important step forward in the journey toward true cross-platform measurement and Nielsen ONE simplifies TV usage, illustrating television consumption behavior in a single graphic. With this view, to be updated monthly, industry participants will be able to see critical behavioral shifts and consumer trends with respect to total TV viewing. Additionally, the Gauge tracks “other” use of the TV, such as via game consoles, to give an accurate view of what people are doing in their dens and living rooms.
Importantly, the Gauge does more than simply chart streaming behavior within U.S. homes that have the ability to stream. The snapshot represents streaming across all television homes, which means that the share of streaming more accurately represents consumer behavior in a way that’s easy to describe and understand. The new representation also shows select streaming distributor shares against the total television universe so it provides better comparability within television usage.
Die Verfolgung des Wachstums des Streaming-Konsums - und dessen Betrachtung neben der sonstigen Fernsehnutzung - ist von entscheidender Bedeutung, da Studios, Sender, Werbetreibende, Agenturen und Branchengruppen Klarheit über die verschiedenen Videoinhalte suchen, mit denen sich die Verbraucher beschäftigen.
Der Ansatz von Nielsen zur Messung der Zuschauerzahlen, der sich auf ein geografisch repräsentatives panel echter Menschen und Big Data stützt, ist auf die Zukunft des Medienkonsums ausgerichtet. Und mit dem the Gauge ist die Zukunft des TV-Konsums in einer einzigen Ansicht sichtbar.
For more information visit The Gauge.
Methodik
- Streaming via cable set top boxes does not credit to the respective streaming distributors, but instead is included in the “all other” group.
- Data used is derived from two separately weighted panels and combined to create the infographic. Streaming data comes from a subset of TV households in the national TV panel that are enabled with the streaming meter, while linear sources as well as total usage are based on viewing from the overall TV panel.
- Verschlüsseltes lineares Streaming wird sowohl in der linearen Gruppe (Rundfunk, Kabel) als auch unter der jeweiligen linearen Streaming-App (z. B. Hulu Live, YouTube TV, andere Streaming-MVPD/vMVPD-Apps) aufgeführt
